 The US dollar has been an ever-present benchmark for the performance of world currencies, often the catalyst for change, large or small. Political turbulence and the subsequent tariff wars have added new pressures in 2025, raising the key questions: how have the US dollar and other major currencies performed this year and what impact could that have on indices?
With analysis of our September Cost of Living Survey now underway, we can look at how exchange rates have performed in the six months from March, and forecast price movements to predict where assignees are likely to be most impacted.
Key exchange rate movements
| March to September survey |
Value vs USD |
| British pound |
6.2% |
| Euro |
10.8% |
| Japanese yen |
1.4% |
| Chinese yuan |
1.7% |
| Australian dollar |
3.8% |
US dollar
In 2025, the US dollar showed its biggest decline in half a century. Between our March and September survey exchange rates, the US dollar depreciated almost 10% versus the euro. although performance against Asian markets was better, depreciating only 1% and 2% relative to the Chinese yuan and Japanese yen respectively.
Despite steady interest rates and upticks in the dollar’s strength in March and July, the dollar weakened into September as slower US growth, fiscal uncertainty and the lingering effects of tariffs pushed investors towards other major currencies. As of mid-September, The Federal Reserve lowering interest rates in mid-September is expected to add further pressure.
Chinese yuan
Amid tariff tensions, the People’s Bank of China aimed to keep the yuan stable as they continue efforts to internationalise the yuan and not repeat the depreciation seen in the first trade war of 2018. While the initial impact of tariffs saw the US dollar make gains, China appears to have succeeded in their objectives in maintaining stability, with the yuan appreciating almost 2% against the US dollar.
Australian dollar
Australia’s close ties to China meant the tariff disputes hit the Australian dollar hard, pushing it to a five-year low in April. Since then, the weaker US dollar has supported a recovery, with the AUD gaining about 4% against the USD.
Japanese yen
Our March 2025 survey rates saw the yen strengthen a little, gradually recovering from its post-pandemic stagnation. The general chaos of global markets, domestic political uncertainty and some missed growth forecasts have made the currency surprisingly volatile. Despite this, the Bank of Japan’s cautious approach has kept the yen relatively stable.
British pound
The pound gained 6% against the US dollar from March to September, with much of its strength attributed to the weakening US economy. As is typical of global exchange rates, the pound and euro have tracked similarly against the dollar, although UK inflation has been higher than the eurozone. This, combined with UK fiscal concerns and Eurozone stability saw the pound depreciate 4% versus the euro.
Eurozone
Of the major currencies, the euro has seen the greatest gains and in September, EUR/USD reached its highest in four years. As with other currencies, the US dollar weakness has played a significant role, although the eurozone has seen growth and economic resilience, lending to the relative attractiveness of the euro.
Forecast index movements
Exchange rate movements form only part of the picture. By also taking into account price movements, we can get early indications of how indices may move in our September Cost of Living Survey and where the impact on internationally mobile staff is likely to be greatest.
Estimated index movements from the Eurozone and United States of America between ECA’s March and September surveys
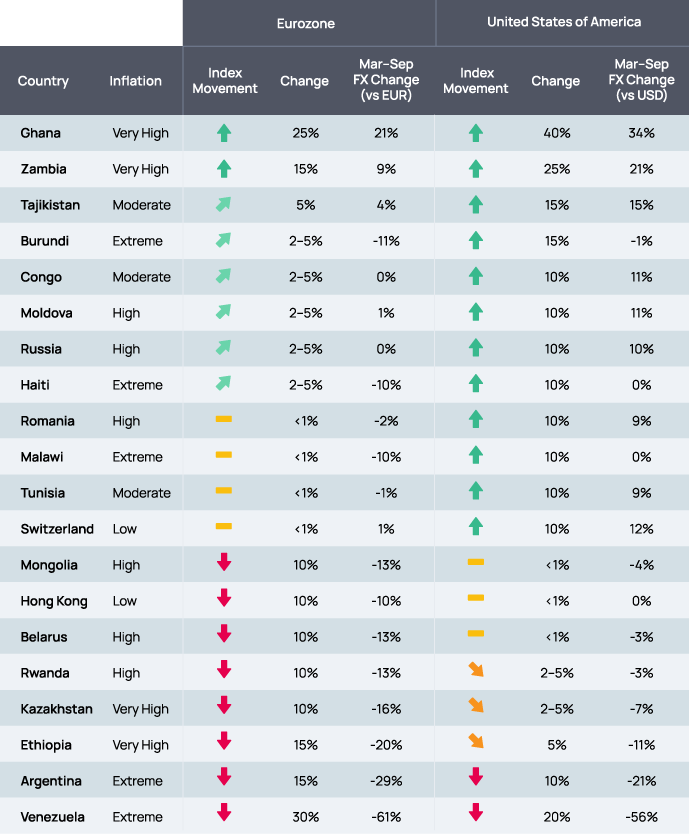
The above table shows countries with high inflation or countries where the difference in estimated index movements is greater than 10% and the home currency is not the euro or US dollar
Venezuela’s economy remains in a state of severe instability, with little prospect of near-term improvements. Our June interim survey saw prices increase over 60% in the three months to June, with the bolivar’s depreciation averaging a 2.5% decline each week, totalling a 56% drop versus the US dollar in the six months to September. With no miraculous changes expected, the significant depreciation will likely outweigh the extreme inflation.
Argentina tells a similar tale, although our interim survey results showed slowing inflation and the latest reports suggest Argentina’s economy is recovering. Whilst the peso has depreciated more than 20% against the major currencies from our March survey exchange rates, it has done so at a consistent pace. Again, the depreciation of the currency will likely outweigh inflation.
Ghana’s currency has been the standout performer of 2025, with the cedi appreciating 21% against the euro and 34% against the US dollar between March and September. Whilst the weaker US dollar has helped, tight monetary policy, high interest rates to combat inflation, and a windfall from high value exports like gold have been key contributors to the cedi’s strength. With inflation slowing, we expect assignees into Ghana to see their indices rise substantially.
As always, index movements depend on both the home and host location. The divergence between the strong euro and weaker US dollar is especially significant. This can be seen in the table above, where potential index movements differ sharply. For example, eurozone assignees in Malawi will not see significant changes to their indices but assignees from the US could see indices increase 10%.
Furthermore, assignees from the eurozone are likely to see their indices fall where inflation is low, with the strength of the euro being the biggest contributor. Moves to dollarised economies could see indices fall 10%. Conversely, assignees from the US and East Asia in Europe could see their indices increase 10%, again reflecting the strong euro.
Monitoring what comes next
Predicting index movements comes with a label of caution. Currency movements and inflationary trends in the past 50 years have been highly volatile, influenced by shifting political and economic developments, from tariff disputes and fluctuations in commodity prices to adjustments in central bank policy.
Whilst it would be wonderful to have a crystal ball, ECA maintains a data-centric approach. The trends we have analysed since March can quickly change, and we will continue to closely monitor global and regional developments in currencies and inflation. The upcoming publication of our September survey data will show how much the weakening US dollar has impacted the global economy and the subsequent effect on cost of living indices.
ECA publishes cost of living data for more than 500 locations around the world. Learn more about our cost of living data by downloading our FREE Cost of Living white paper which explains how ECA's indices are calculated and applied to protect the buying power of people moving between countries as well as looking at what causes them to change over time.
Our cost of living data is available as part of a subscription or as one-off calculations. It is also built into ECA’s Build-up, Net-to-Net and Cost Estimate Calculators which enable calculations in seconds. Get in touch today!